

chmonitor v0.3.8 ships 45 new features, 106 fixes, and 6 performance changes since v0.3.7. The advisor finds data nobody reads, detached parts get a careful triage, storage shows which queries hit a table, and alert reminders are quieter.
What’s new in v0.3.8
Find what nobody reads
The advisor now looks at the query log window and reports tables nobody read, columns nobody read, and projections no query used. Each one is an insight on the overview and a storage view of its own, and the agent can ask for the same list with a tool. The advisor also questions codecs that do not match the data, and judges size savings from the measured compression ratio.
Detached parts triage
Detached parts are easy to get wrong: some are still owned by ClickHouse, some are broken, and some look covered but only on one replica. The new detached parts triage view groups them by table and reason, and gives each group a review class.
- cannot_drop_via_sql — attaching, deleting, or tmp-fetch parts that ClickHouse still owns.
- needs_attention — broken, broken-on-start, unexpected, or noquorum parts. Coverage never makes these reviewable.
- review_after_coverage_check — ignored, clone, or covered-by-broken parts that sit inside an active part of the same partition, older than 30 days.
- review — everything else.
Coverage is checked on this replica only, so no class means “safe to drop”. The agent tool is read-only: it never writes a DROP or ATTACH command, and the owner decides.
Hot query shapes
Open a table in storage and the new hot query shapes view lists the normalized queries that hit it, how often they ran, and how many bytes they read. It is the fastest way to see who depends on a table before you change its sort key or drop it.
Insights
New checks flag work that rewrites data without adding any:
- Tables optimized again and again with no new data.
- TTL merges that rewrite far more data than is ingested.
- A retention forecast for the table that dominates ingest.
Insight enrichment now caps its output tokens, and the sweep can skip the LLM entirely.
Alerts
Repeat reminders know when to stop. You can set a cooldown and mute per rule, a repeat interval per severity, and an opt-in back-off while a value stays flat. Reminders that barely moved are skipped, and the ones that are sent show how long the alert has been open and how much the value changed. Custom targets can be told to alert once until resolved, with one-line digest reminders.
Alerts now carry the deployment name, a dashboard link, and metadata, and Matrix hookshot is a new webhook format. Alerts can also go to a Matrix or Element room natively, and each sweep sends one grouped message per room.
Every channel now shows the same alert facts: severity, value, thresholds, status, runbook, dashboard link, and the same RESOLVED wording. A recovery says how long the alert fired. Before this, Matrix and hookshot dropped thresholds and runbooks, and some digests had no dashboard link.
Webhooks are harder to misuse. A saved webhook or ntfy URL is checked again
on every send, not only when you save it. The webhook proxy and the
healthchecks pings refuse redirects, so a target cannot bounce a request to
a host the check did not allow. New built-in rules cover dictionaries
that fail to load, stuck Distributed send queues, running queries near
max_concurrent_queries, and disks that will fill within 24 hours.
Runaway queries page only when the server hurts
A slow query on a healthy server is not an emergency. Two new signals watch for runaway queries: long-running queries (warning at 10 minutes, critical at 1 hour) and heavy query memory (the heaviest query as a share of the server memory limit, warning at 30%, critical at 50%). Both show on the health page, and neither sends a message on its own.
The new runaway-query-impact rule pages only when one of those signals is
at least warning and memory-pressure or concurrent-queries is critical.
The page names the offending queries. Its remediation is read-only diagnostic
SQL. There is no kill button.
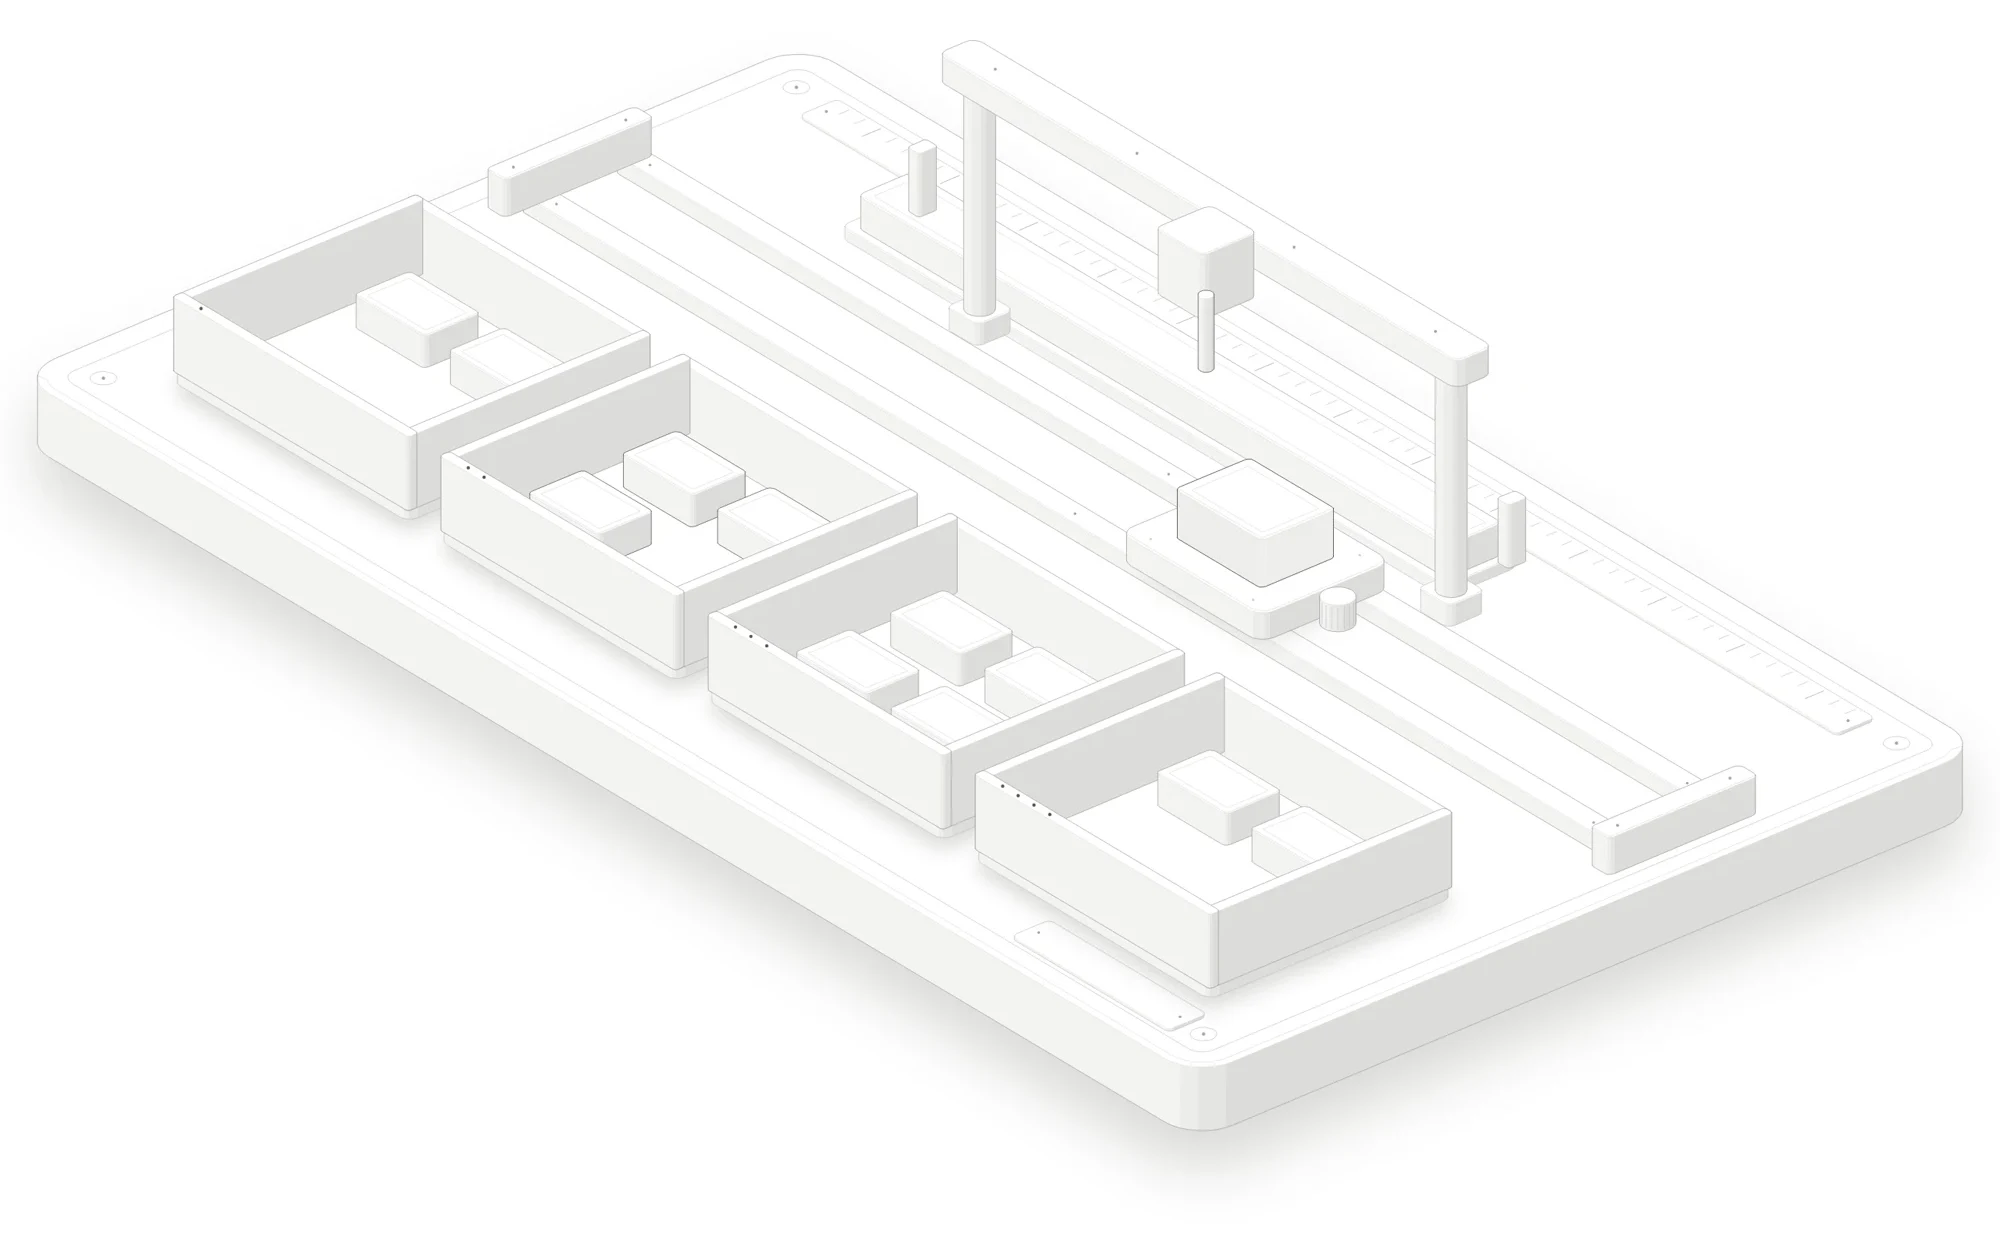
The figure below is that rule as a machine. The left gauge is the heaviest query, the right gauge is server memory pressure. Each carriage pulls its bolt when it passes its stop. The hammer rings the bell only when both bolts are out.
Who can read what, and who uses the server
The new access matrix under Security shows users or roles against databases, and expands to tables. Each cell reads none, read, write, or admin, and marks access that comes through a role, a partial revoke, or a readonly cap. Open a cell for a sheet that lists each privilege and where it comes from, plus the row policies and quotas that apply.
The new usage by user page under Queries lists one row per user over the query log window, including inactive users, with a name filter and a preset to hide system users. Open a user for a detail page: KPI tiles for queries, failed share, p95 duration and bytes read, a yearly activity calendar, a weekday by hour heatmap, top tables, top query shapes, errors, and clients. Both pages read this replica only.
Also in this release
- The agent gained an
explain_clickhouse_symboldocs lookup tool and a settings-audit skill, and PeerDB and Postgres tools turn on when they are configured and reachable. scripts/verify-alerting.tsruns every alert rule on a real ClickHouse and sends a real alert to every channel format, so you can check rules and delivery end to end.- Large sidebar groups have collapsible subgroups.
- Charts pause auto-refresh when they scroll out of view.
- In cloud mode, more API routes require sign-in, and many query configs now run on older and newer ClickHouse versions.
Upgrading
Pull the new image or redeploy. The detached parts review alert is opt-in, and repeat-reminder back-off is off until you turn it on.
docker pull ghcr.io/chmonitor/chmonitor:0.3.8On Kubernetes, Helm chart 0.2.18 ships with this release. It carries the alert changes above: the deployment name and dashboard link in alerts, the Matrix hookshot format, grouped hookshot and Matrix alerts per sweep, and once-until-resolved custom targets.
helm repo update
helm upgrade my-chm chmonitor/chmonitor --version 0.2.18
Read more
- chmonitor v0.3.7 — an agent that reads your page
- Deploy chmonitor on Kubernetes with Helm
- AI agent docs
- GitHub release v0.3.8